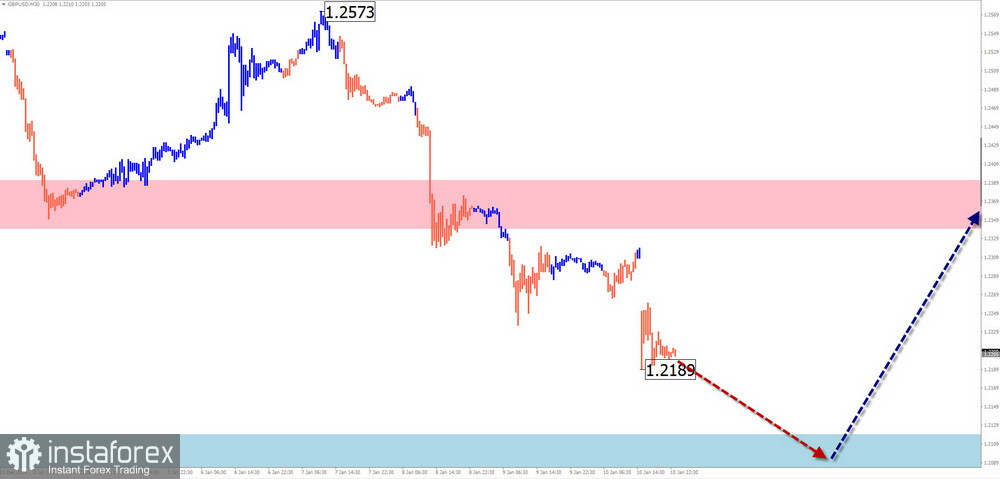
GBP/USD
Analysis:On the chart of the British pound major, the short-term trend since last summer has been dictated by a descending wave algorithm. The wave's structure does not appear to be complete as of now. The quotes are approaching intermediate support.
Forecast:In the first half of the week, a continuation of the bearish price movement is expected, likely reaching the support boundaries. Subsequently, sideways price fluctuations are anticipated along the zone's boundaries. Toward the weekend, increased volatility and a potential directional shift leading to an upward move are likely. Price growth is expected to remain within the calculated resistance area.
Potential Reversal Zones:
- Resistance: 1.2340/1.2390
- Support: 1.2120/1.2070
Recommendations:
- Purchases: Low potential and may lead to losses.
- Sales: May be used after the upcoming upward correction concludes and confirmed reversal signals appear near the resistance zone.
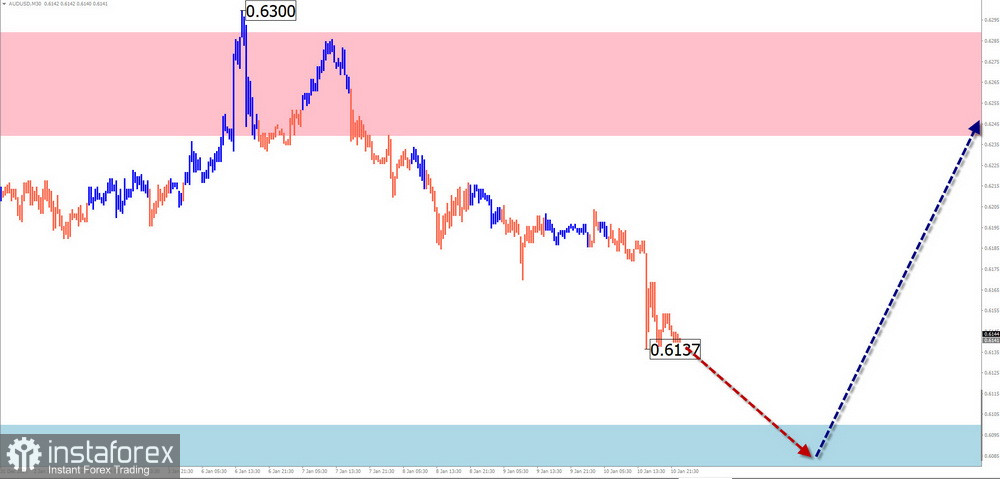
AUD/USD
Analysis:On the chart of the Australian dollar against the US dollar, an incomplete bearish wave model from September 30 remains the primary focus. The price has reached the upper boundary of a potentially pivotal reversal zone on the higher timeframe (TF). The quotes are located between opposing reversal zones on different TFs.
Forecast:A continued decline is expected in the coming day, followed by sideways price movement near the support boundaries. After potential pressure on this zone, a reversal formation is anticipated, with price growth more likely by the end of the week. The upward range is expected to stay below the calculated resistance.
Potential Reversal Zones:
- Resistance: 0.6240/0.6290
- Support: 0.6100/0.6050
Recommendations:
- Sales: Due to low potential, they may result in losses.
- Purchases: After reversal signals appear near support, small volume trades may be considered.
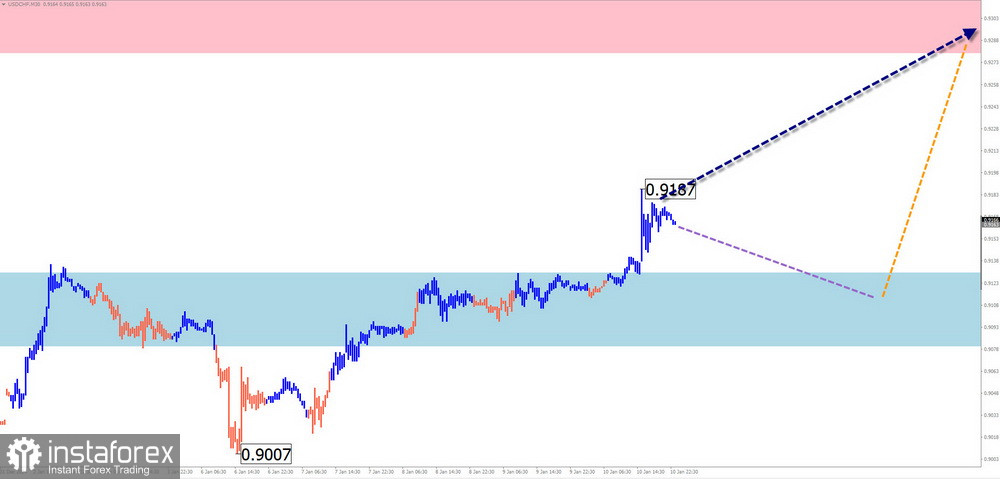
USD/CHF
Analysis:The USD/CHF pair continues to form an ascending flat pattern since last summer. The final segment (C) has been developing since December. Recently, a horizontal correction has formed within this segment, which remains incomplete.
Forecast:An overall upward trajectory is expected next week. A downward pullback is likely in the early days, followed by a reversal and resumed price growth. A brief breakout below the support zone cannot be ruled out during the direction change.
Potential Reversal Zones:
- Resistance: 0.9280/0.9330
- Support: 0.9130/0.9080
Recommendations:
- Sales: No conditions for such trades in the pair.
- Purchases: May be used after reversal signals appear near support, with reduced trade volume sizes for safety.
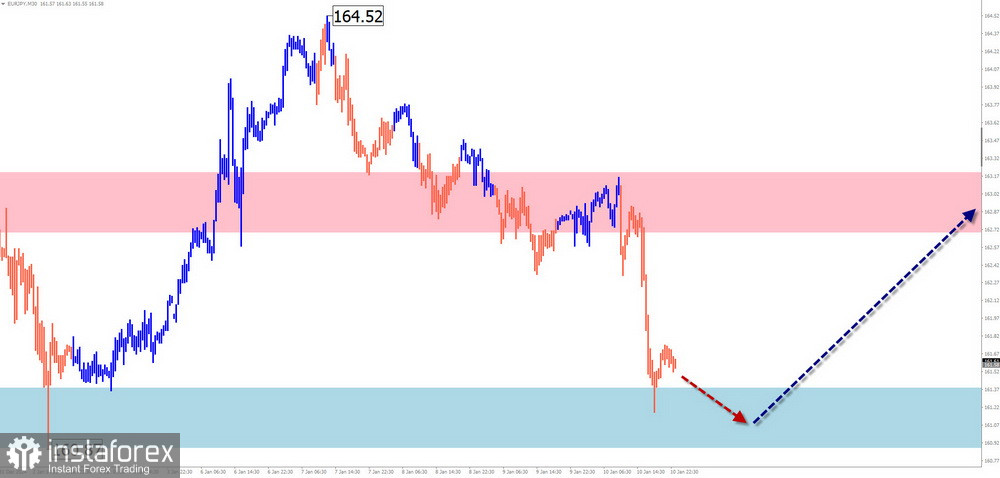
EUR/JPY
Analysis:Since late December, the EUR/JPY pair has been forming a descending wave structure. On the weekly scale, this wave represents a correction to the last segment of the primary trend. The quotes have reached the lower boundary of a strong potential reversal zone. There are no clear signals of an imminent reversal yet.
Forecast:In the first half of the week, continued price declines are expected, reaching the calculated support. A directional shift may occur closer to the weekend, with price growth unlikely to exceed the resistance boundaries.
Potential Reversal Zones:
- Resistance: 163.00/163.50
- Support: 161.10/160.60
Recommendations:
- Sales: Risky due to limited potential.
- Purchases: Viable after confirmed reversal signals appear near support for potential trades.
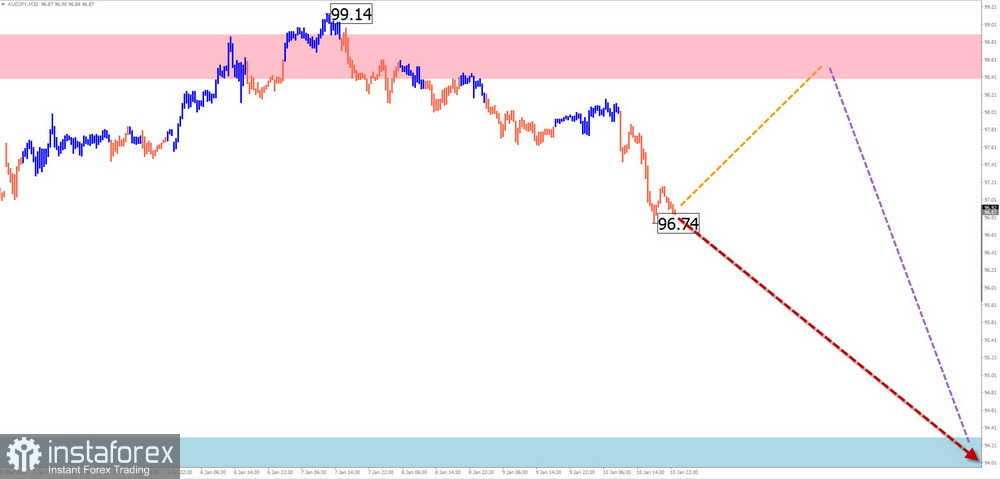
AUD/JPY
Brief Analysis:The AUD/JPY pair's short-term fluctuations have followed an ascending wave algorithm since last August. The current segment is corrective, starting in early October, and remains incomplete as of the analysis. Quotes are near the calculated resistance zone.
Weekly Forecast:In the next couple of days, renewed pressure on the resistance zone is possible. During the second half of the week, a reversal and a downward price movement toward the support levels are anticipated.
Potential Reversal Zones:
- Resistance: 98.40/94.90
- Support: 94.30/93.80
Recommendations:
- Purchases: Limited potential and may lead to losses.
- Sales: Possible after confirmed reversal signals appear near the resistance zone.
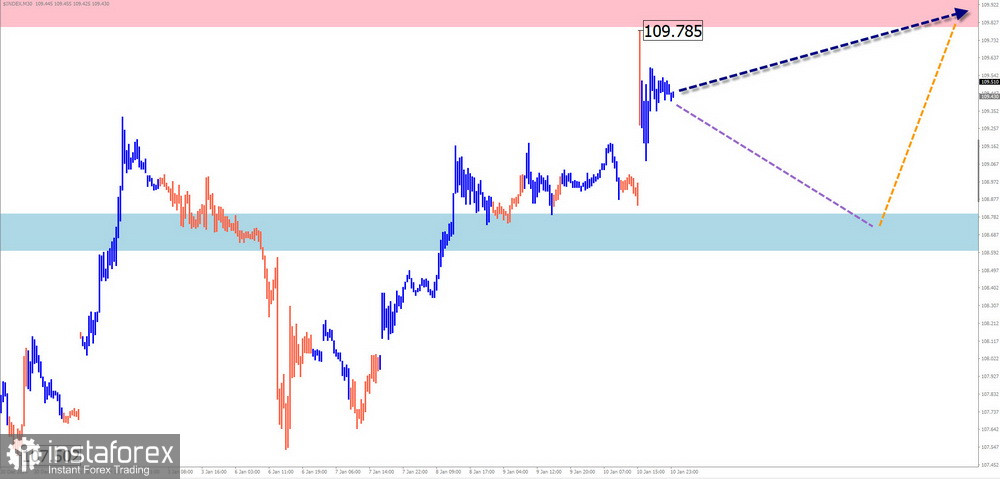
US Dollar Index
Brief Analysis:The US Dollar Index remains dominated by an ascending wave that began in September last year. Since mid-December, a corrective phase has been forming, represented by a shifting flat. The correction structure remains incomplete.
Weekly Forecast:Sideways movement is expected for the index in the coming week. In the next couple of days, a brief pullback to the support zone is possible. A resumption of the upward trend is more likely closer to the weekend.
Potential Reversal Zones:
- Resistance: 109.80/110.00
- Support: 108.80/108.60
Recommendations:
- Purchases: No conditions for buying USD in the coming week.
- Sales: During dollar weakening phases, trades favoring stronger national currencies in major pairs may be profitable.
Explanations:
In simplified wave analysis (SWA), all waves consist of three parts (A-B-C). The analysis focuses on the last incomplete wave for each timeframe. Dashed lines indicate expected movements.
Note: The wave algorithm does not consider the duration of instrument movements over time!