The EUR/USD currency pair continued to trade in a downward trend on Thursday, and this time, no one even questioned: "Why?" Recall that at the beginning of the week, the market was swept by a wave of optimism due to Donald Trump's statement about the imminent end of the war in Iran. According to the American leader, nearly all objectives have been achieved, and the Strait of Hormuz will be unblocked one way or another—either by Iran or by the U.S. Navy. However, as practice shows, nothing like that will happen in the near future. A convoy of U.S. Navy vessels entering the Strait of Hormuz will mean only one thing: Iran will strike at them. Iran is unwilling to voluntarily lift the blockade, which serves as a key pressure point on the U.S. and the world.
In order for Tehran's words not to be seen as mere bluster, Iran carried out no less than six strikes on tankers near the Strait of Hormuz on Wednesday. Thus, we see that the statements of Iranian officials carry weight, whereas the U.S. president is making promises that the market does not understand how to fulfill.
In our view, Trump has initiated yet another behind-the-scenes game, the true motives of which are known to very few. Initially, it seemed that the war in Iran was a pretext to block oil and gas supplies to China, as China remains the U.S.'s main competitor on the world stage. Perhaps this is indeed the case. Yesterday, a suggestion was made that the U.S. has taken the status of the world's largest marine cargo insurer from the UK by waging war in Iran. Simply put, no insurance company in the world is currently willing to insure tankers passing through the Strait of Hormuz, while American companies are ready to do so. However, it remains unclear how these insured American vessels will manage to exit the conflict region. Yet, this hypothesis also exists.
It is clear that there was no urgent need to attack Iran right now. Perhaps Iran does indeed pose a threat to the Western world; however, Trump could not have been unaware of the consequences this would lead to. The entire Western world (and not just the West) is currently held hostage by Iran. Of course, oil is available not only in the Middle East, but oil prices could also rise to $200 per barrel, which would hurt the economies of many countries. Not to mention the inflation that many central banks have struggled with for years. Thus, strangely enough, Tehran hopes that Western countries will stop Trump when they can no longer cope with skyrocketing oil and gas prices. This is also a hypothesis, but what else can we do now except build hypotheses? It is evident that the war did not start for nothing, nor because Iran was ready to launch ballistic and nuclear missiles at Europe or the U.S. tomorrow.
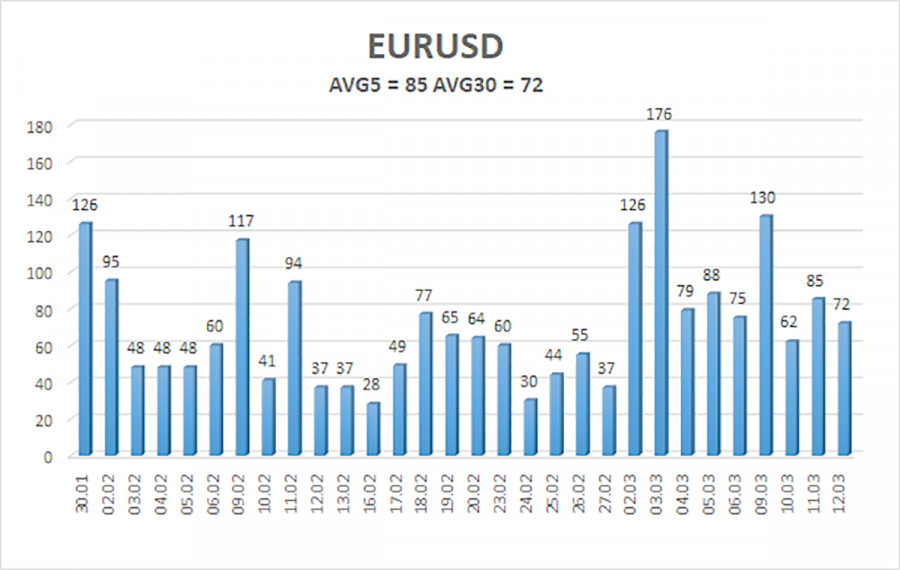
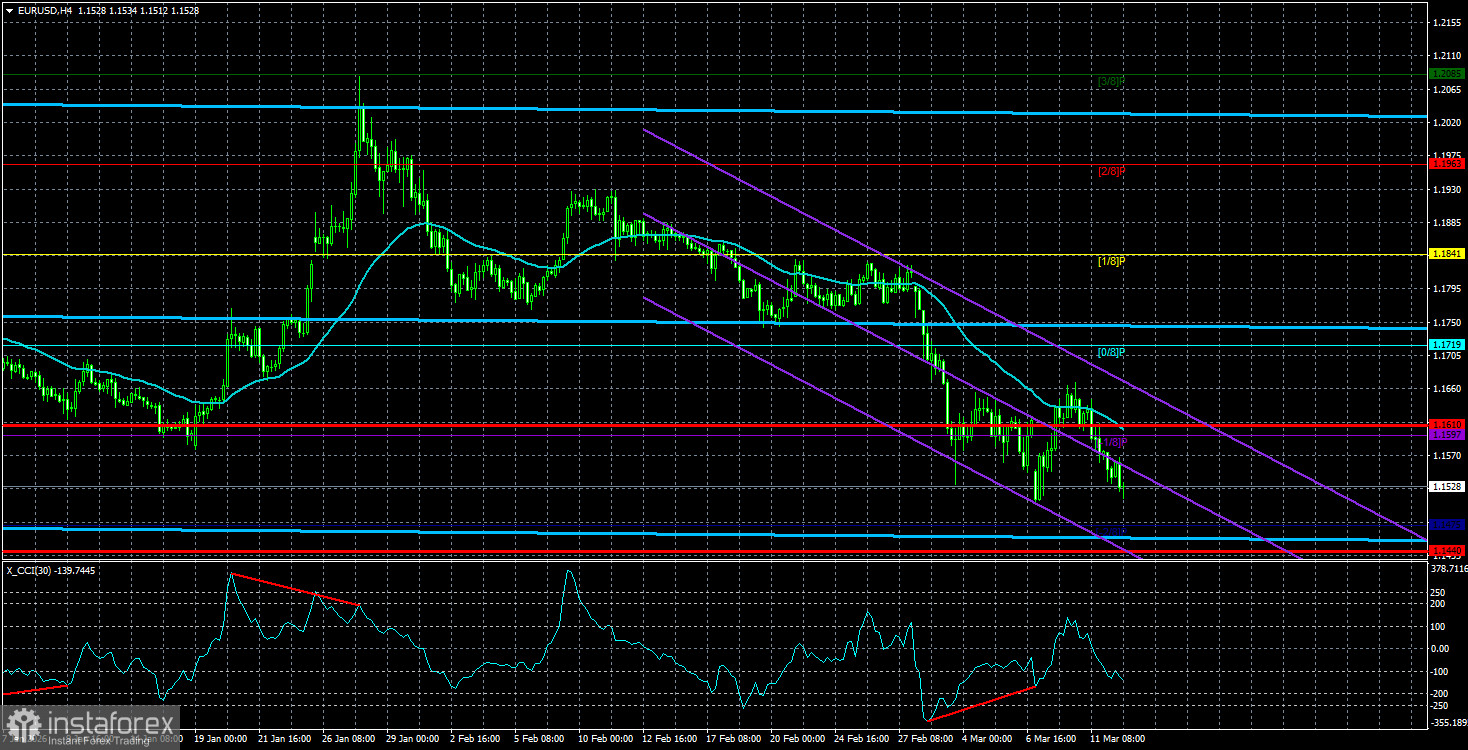
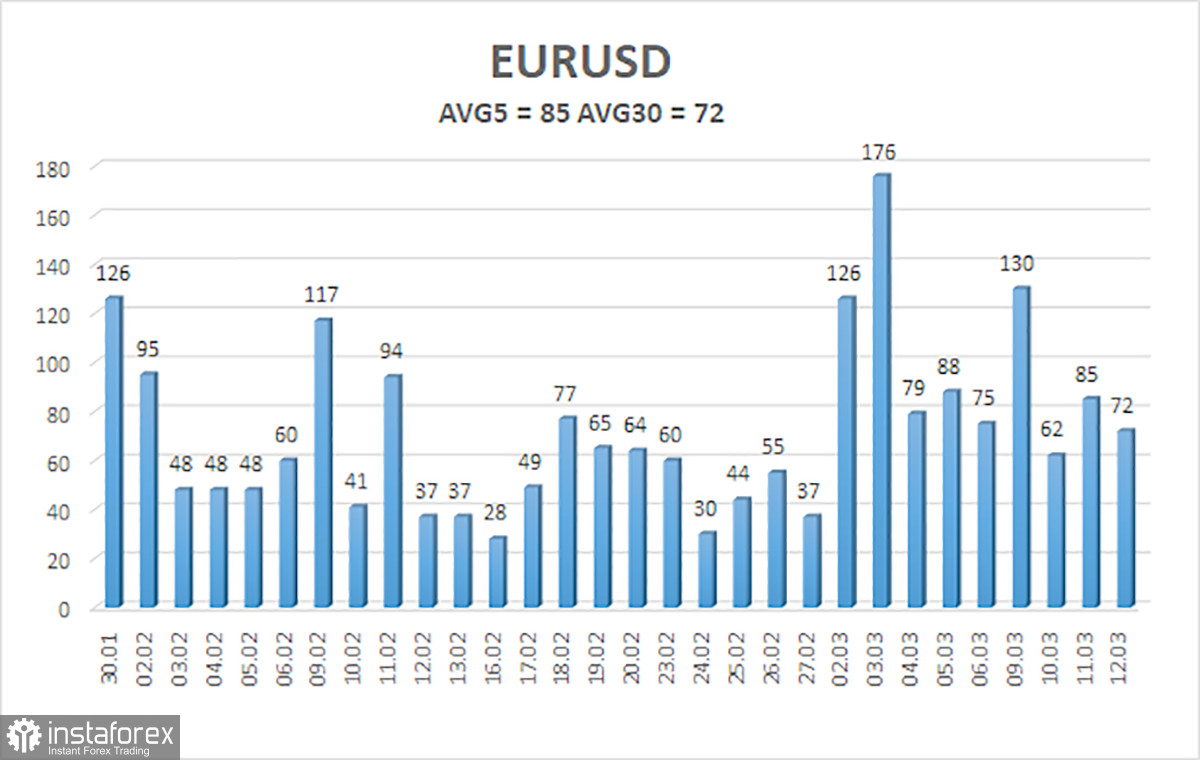
The average volatility of the EUR/USD currency pair over the last 5 trading days, as of March 13, is 85 pips and is characterized as "average." We expect the pair to trade between 1.1440 and 1.1610 on Friday. The upper linear regression channel has flattened out, indicating a trend reversal. The CCI indicator has once again entered oversold territory, signaling a potential resumption of the upward trend. Additionally, a "bullish" divergence has formed.
Nearest Support Levels:
S1 – 1.1475
Nearest Resistance Levels:
R1 – 1.1597
R2 – 1.1719
R3 – 1.1841
Trading Recommendations:
The EUR/USD pair continues its correction within the upward trend. The global fundamental backdrop remains extremely negative for the dollar. The pair has spent seven months in a sideways channel, and it is likely time to resume the global trend of 2025. The dollar lacks a fundamental basis for long-term growth. We are currently witnessing another global correction.
With the price located below the moving average, small shorts can be considered targeting 1.1475 and 1.1440 based on technical grounds and due to the complex situation in the Middle East. Above the moving average line, long positions remain relevant with targets at 1.1963 and 1.2085.
Explanations for the Illustrations:
- Linear regression channels help determine the current trend. If both are directed in the same direction, it means the trend is currently strong;
- The moving average line (settings 20.0, smoothed) determines the short-term trend and the direction in which trading should currently be conducted;
- Murray levels – target levels for movements and corrections;
- Volatility levels (red lines) – the likely price channel in which the pair will operate over the next day, based on current volatility indicators;
- The CCI indicator – its entry into the oversold area (below -250) or the overbought area (above +250) indicates that a reversal of the trend in the opposite direction is approaching.