empty
31.07.2025 01:23 PM
Forecast for EUR/USD on July 31, 2025

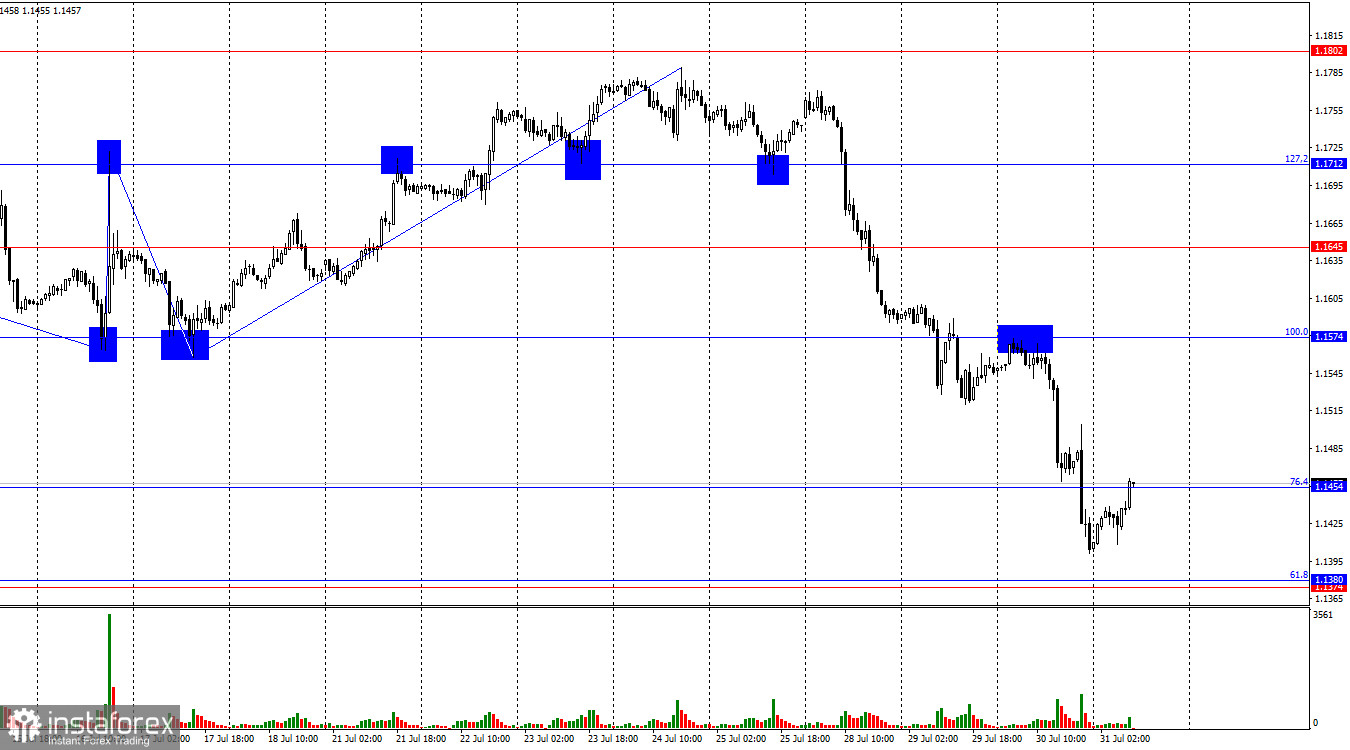
On Wednesday, the EUR/USD pair continued its decline after rebounding from the 100.0% Fibonacci retracement level at 1.1574. By the end of the day, the pair closed below the 76.4% level at 1.1454, opening the way for a further drop toward the support zone of 1.1374–1.1380. A consolidation above 1.1454 would work in favor of the euro and suggest a potential recovery toward 1.1574. Bears remain in control, and for the first time in a while, the news background is clearly supporting them.

This image is no longer relevant

The wave structure on the hourly chart remains straightforward. The most recent completed upward wave broke above the previous peak, while the last downward wave broke below the prior low. This indicates a bearish trend, although it has been shifting frequently due to news-driven sentiment. Donald Trump managed to secure several advantageous trade deals, boosting the bears. However, it's worth noting that many of the U.S.'s trading partners have yet to reach an agreement with Washington.

On Wednesday, market attention was focused not on the FOMC outcome itself, but on Jerome Powell's remarks—and for good reason. Lately, the prevailing view had been that the Fed would cut rates twice in the second half of 2025. It's unclear why so many traders and analysts expected this, given that inflation has been accelerating and Powell has consistently stated since the start of the year that the new trade reality is likely to impact consumer prices. One of the Fed's primary targets is to maintain price stability around 2% annual growth. Therefore, if inflation is rising, the Fed has no reason to ease monetary policy. Some concerns had centered around the risk of a U.S. recession, which might force the Fed to cut rates. However, just six hours before the FOMC meeting ended, Q2 GDP data was released showing 3% growth. That evening, Powell indicated that the extent of policy easing by year-end may be less than 50 basis points.

This image is no longer relevant

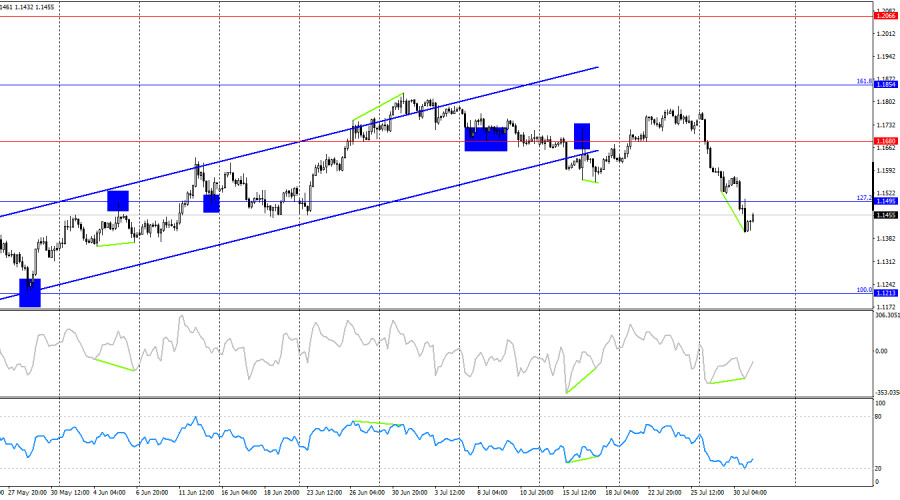
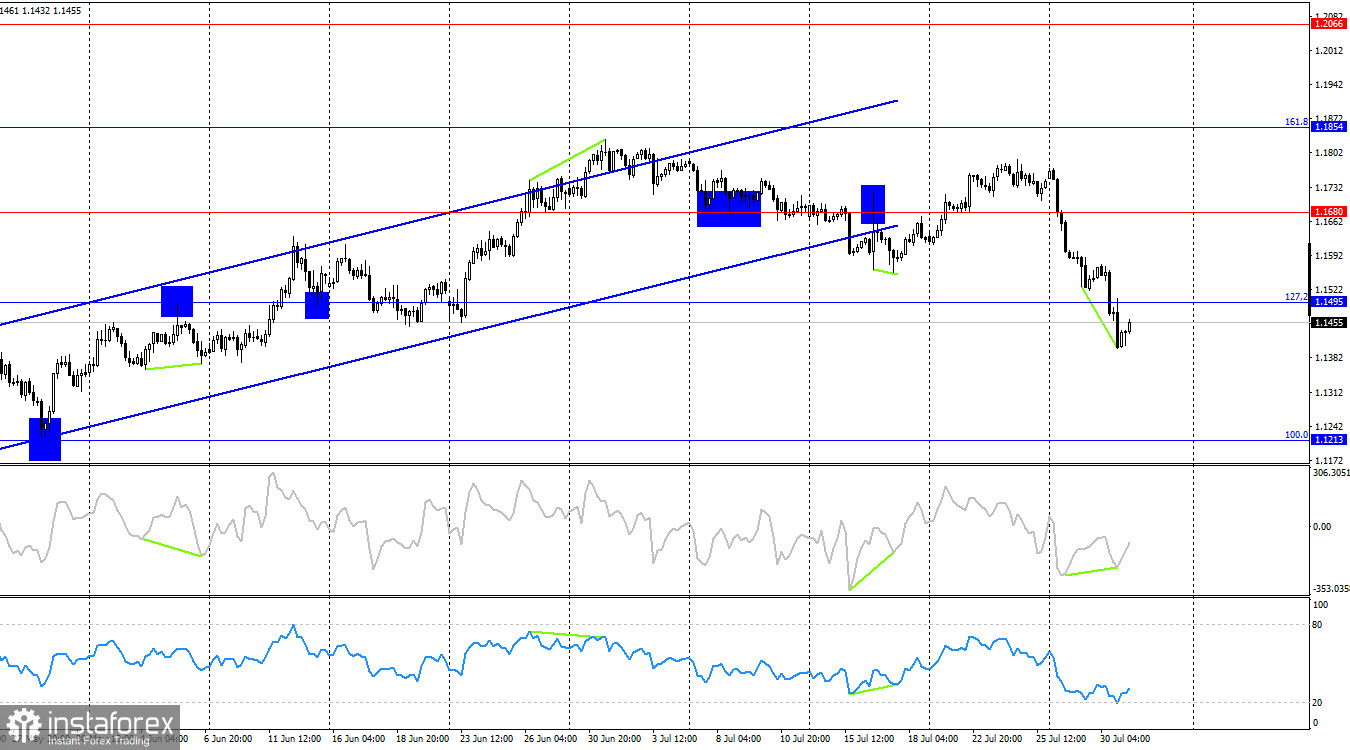
On the 4-hour chart, the pair reversed in favor of the U.S. dollar and closed below the 127.2% Fibonacci level at 1.1495. Earlier, the euro also broke below the ascending trend channel. I'm still hesitant to conclude that a bearish trend has fully formed. The U.S.–EU trade deal gave the bears momentum, but sustained and consistent bearish sentiment is needed for a continued move toward the 100.0% retracement level at 1.1213. The CCI indicator has formed a bullish divergence.

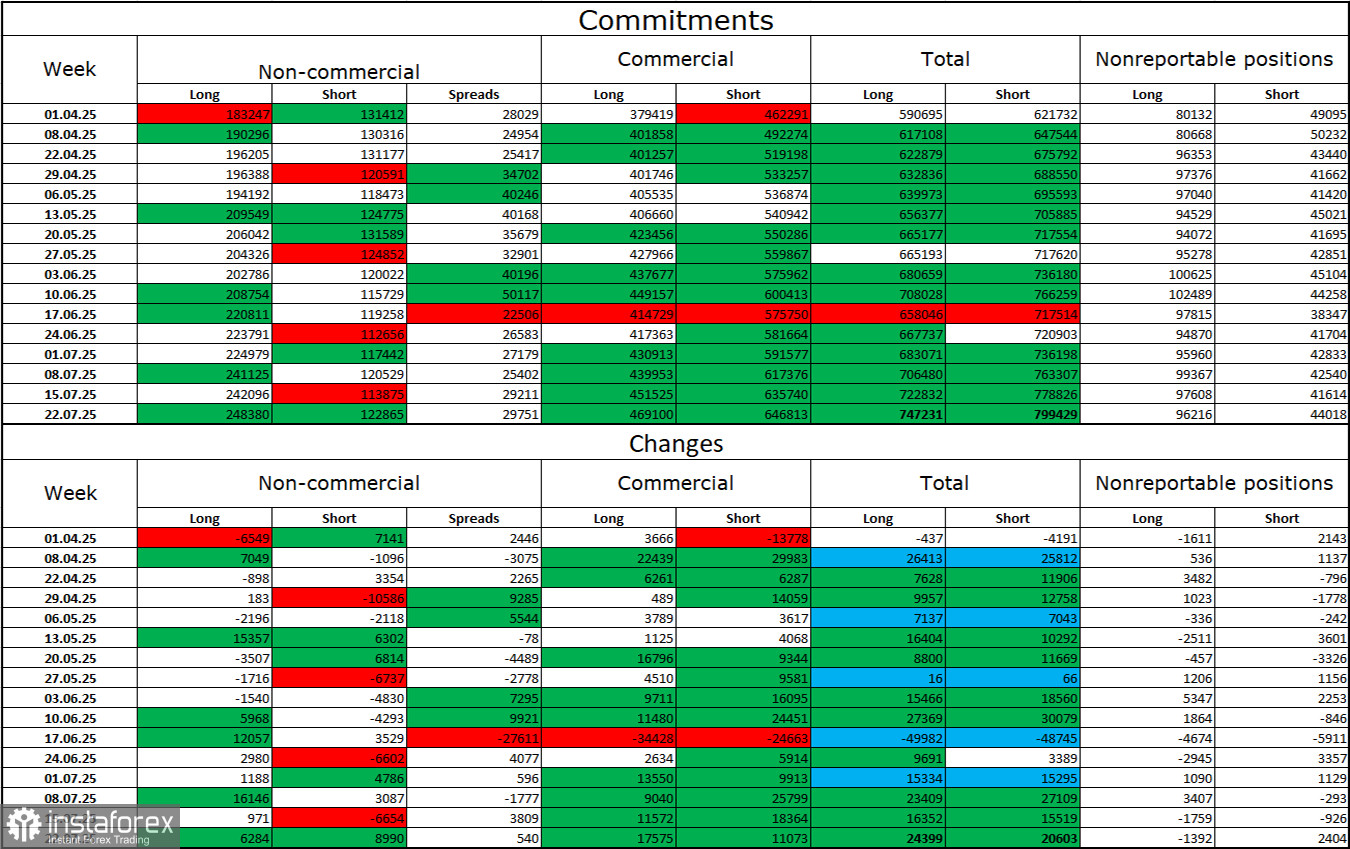
Commitments of Traders (COT) Report:

This image is no longer relevant

During the latest reporting week, professional traders opened 6,284 long and 8,990 short positions. Sentiment among the "non-commercial" category remains bullish, largely thanks to Donald Trump, and continues to strengthen. Speculators now hold 248,000 long positions and 122,000 short—more than a 2:1 ratio. Note the large number of green cells in the table above, indicating a strong increase in euro positions. In most cases, interest in the euro continues to grow, suggesting waning interest in the dollar.

For 24 consecutive weeks, large traders have been reducing short positions and increasing long ones. Donald Trump's policies remain the most significant factor for traders, as they could trigger a recession and other long-term structural challenges for the U.S. economy. Despite several major trade agreements being signed, I still don't see a shift in the overall sentiment among institutional players.

Economic Calendar for the U.S. and Eurozone:

  • Eurozone – Germany Unemployment Rate (07:55 UTC)
  • Eurozone – Eurozone Unemployment Rate (09:00 UTC)
  • Eurozone – Germany CPI (12:00 UTC)
  • U.S. – PCE Index (12:30 UTC)
  • U.S. – Personal Income and Spending (12:30 UTC)
  • U.S. – Initial Jobless Claims (12:30 UTC)

The July 31 calendar includes six notable events. While the news background may not trigger strong market moves on Thursday, its influence is expected to be consistent throughout the day.

EUR/USD Forecast and Trader Recommendations:

Selling the pair was possible after a close below 1.1712 with a target of 1.1645. That target, and the next one at 1.1574, were both reached. New selling opportunities emerged after a close below 1.1574, targeting 1.1454—also successfully hit. Today, I do not recommend selling. Buying may be considered if the pair closes above 1.1454, with a target of 1.1574.

Fibonacci levels are plotted from 1.1574 to 1.1066 on the hourly chart and from 1.1214 to 1.0179 on the 4-hour chart.

Samir Klishi,
Analytical expert of InstaForex
© 2007-2025
Summary
Urgency
Analytic
Grigory Sokolov
Start trade
Earn on cryptocurrency rate changes with InstaForex
Download MetaTrader 4 and open your first trade
  • Grand Choice
    Contest by
    InstaForex
    InstaForex always strives to help you
    fulfill your biggest dreams.
    JOIN CONTEST

Recommended Stories

Forex forecast 01/09/2025: EUR/USD, GBP/USD, USD/JPY, Gold and Bitcoin

Useful links: My other articles are available in this section InstaForex course for beginners Popular Analytics Open trading account Important: The begginers in forex trading need to be very careful

Sebastian Seliga 15:13 2025-09-01 UTC+2

EUR/USD. September 1st. The Week Begins with Lagarde's Speech

On Friday, the EUR/USD pair continued its upward movement and, on the third attempt, consolidated above the 76.4% Fibonacci correction level – 1.1695. Thus, growth may continue on Monday toward

Samir Klishi 12:17 2025-09-01 UTC+2

Forecast for GBP/USD on September 1, 2025

On the hourly chart, the GBP/USD pair on Friday fell below the 76.4% Fibonacci level – 1.3482, but then reversed in favor of the pound and began a new upward

Samir Klishi 11:52 2025-09-01 UTC+2

GBP/USD. Technical Analysis for September 2025

In August, the pair, moving upward, tested the historical resistance level at 1.3579 (blue dotted line) and then pulled back slightly, closing the monthly candle at 1.3502. In September

Stefan Doll 11:15 2025-09-01 UTC+2

Will XAU/USD (Gold) continue its strengthening today? Monday, September 01, 2025.

[XAU/USD (Gold)] – [Monday, September 01, 2025] Gold is highly likely to continue its strengthening today, as it is confirmed by the both of EMAs crossing a Golden Cross

Arief Makmur 10:13 2025-09-01 UTC+2

The Loonie is testing its Pivot Resistance. If it fails to break through, then it has the potential to continue the decline. Monday, September 01, 2025.

[USD/CAD] – [Monday, September 01, 2025] With the EMA(50) condition below the EMA(200) as well as the RSI at a neutral bearish levels, it has the potential to continue

Arief Makmur 10:13 2025-09-01 UTC+2

EUR/USD. Technical Analysis for September 2025

In August, the pair, moving upward, tested the historical resistance level of 1.1710 (blue dotted line) and then pulled back slightly, closing the monthly candle at 1.1685. In September

Stefan Doll 09:53 2025-09-01 UTC+2

GBP/USD. Technical Analysis for the Week of September 1–6

Last week, the pair moved downward, tested the 21-period simple moving average at 1.3428 (black dotted line), and then turned upward, closing the weekly candle at 1.3502. In the upcoming

Stefan Doll 09:50 2025-09-01 UTC+2

EUR/USD. Technical Analysis for the Week of September 1–6

Last week, the pair moved downward, tested the upper fractal at 1.1571 (red dotted line), and then turned upward, closing the weekly candle at 1.1685. In the upcoming week

Stefan Doll 09:46 2025-09-01 UTC+2

GBP/USD. Indicator Analysis on September 1, 2025

On Friday, the pair moved downward, tested the 21-period simple moving average at 1.3449 (black dotted line), and then turned upward, closing the daily candle at 1.3502. Today, the price

Stefan Doll 09:42 2025-09-01 UTC+2
Can't speak right now?
Ask your question in the chat.
Widget callback
 

Dear visitor,

Your IP address shows that you are currently located in the USA. If you are a resident of the United States, you are prohibited from using the services of InstaFintech Group including online trading, online transfers, deposit/withdrawal of funds, etc.

If you think you are seeing this message by mistake and your location is not the US, kindly proceed to the website. Otherwise, you must leave the website in order to comply with government restrictions.

Why does your IP address show your location as the USA?

  • - you are using a VPN provided by a hosting company based in the United States;
  • - your IP does not have proper WHOIS records;
  • - an error occurred in the WHOIS geolocation database.

Please confirm whether you are a US resident or not by clicking the relevant button below. If you choose the wrong option, being a US resident, you will not be able to open an account with InstaForex anyway.

We are sorry for any inconvenience caused by this message.